Statistics preview
See your observations over time
Review intake and output charts, urgency, timing, and daily summaries. Each section below shows how your recorded observations can come together.
Example screens · sample data. These slightly faded screenshots show what each section can contain. They are not interactive and do not show your diary. Charts describe what you record; missing entries and unmeasured amounts affect the picture.
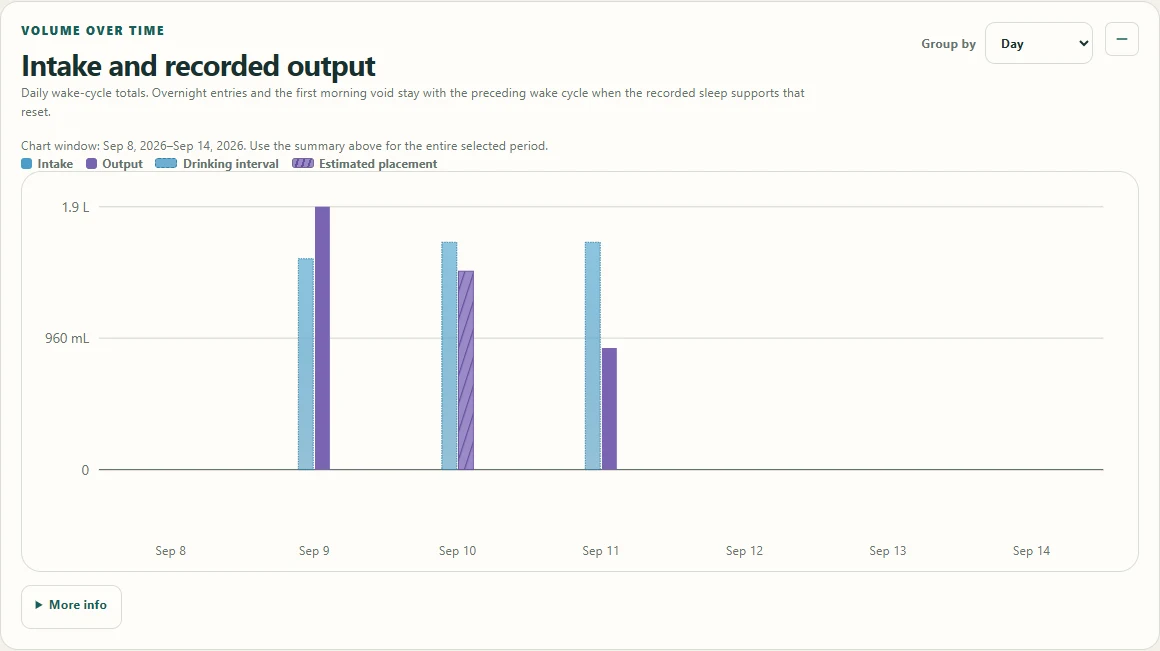
Intake and output over time
Compare recorded drinks and urinary output across time. Measured and estimated amounts remain distinguishable.
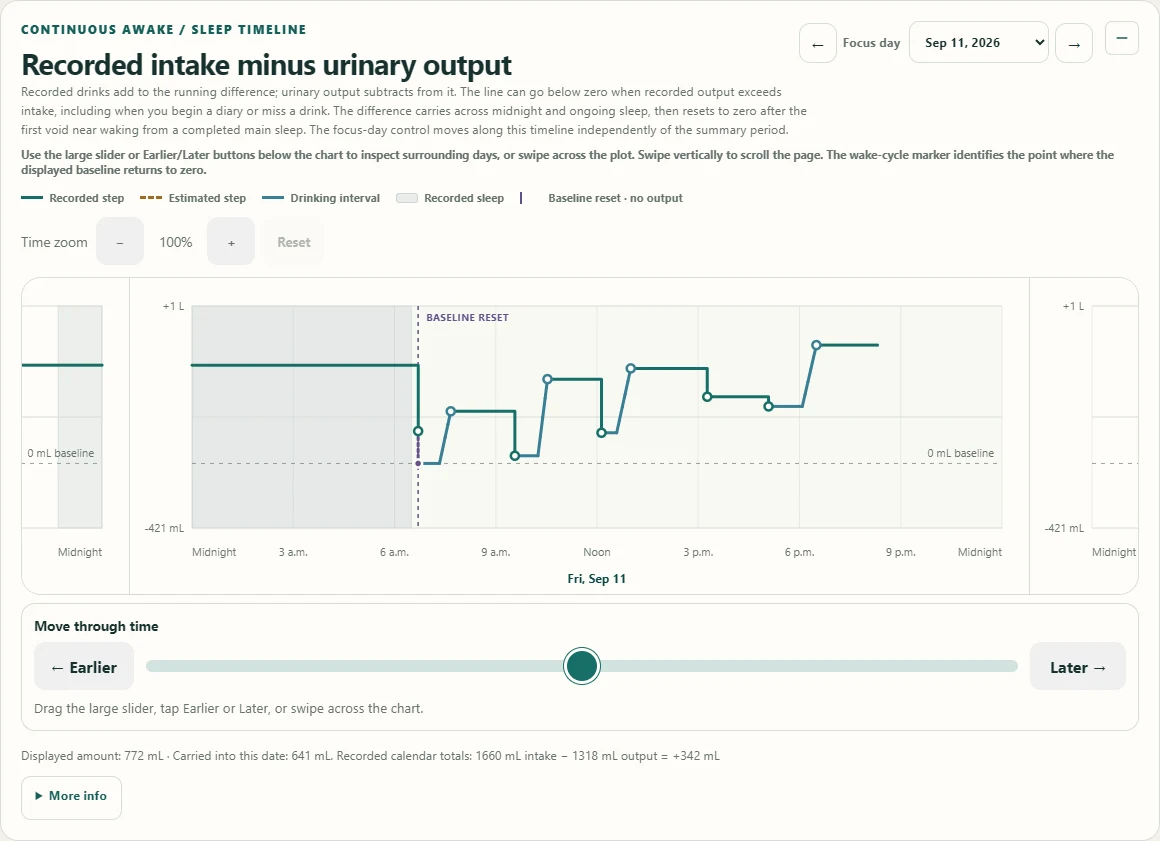
Recorded intake minus output
Follow how recorded drinks add to the total and urinary output subtracts from it. This is a record of entries, not a measure of hydration or fluid retained by your body.
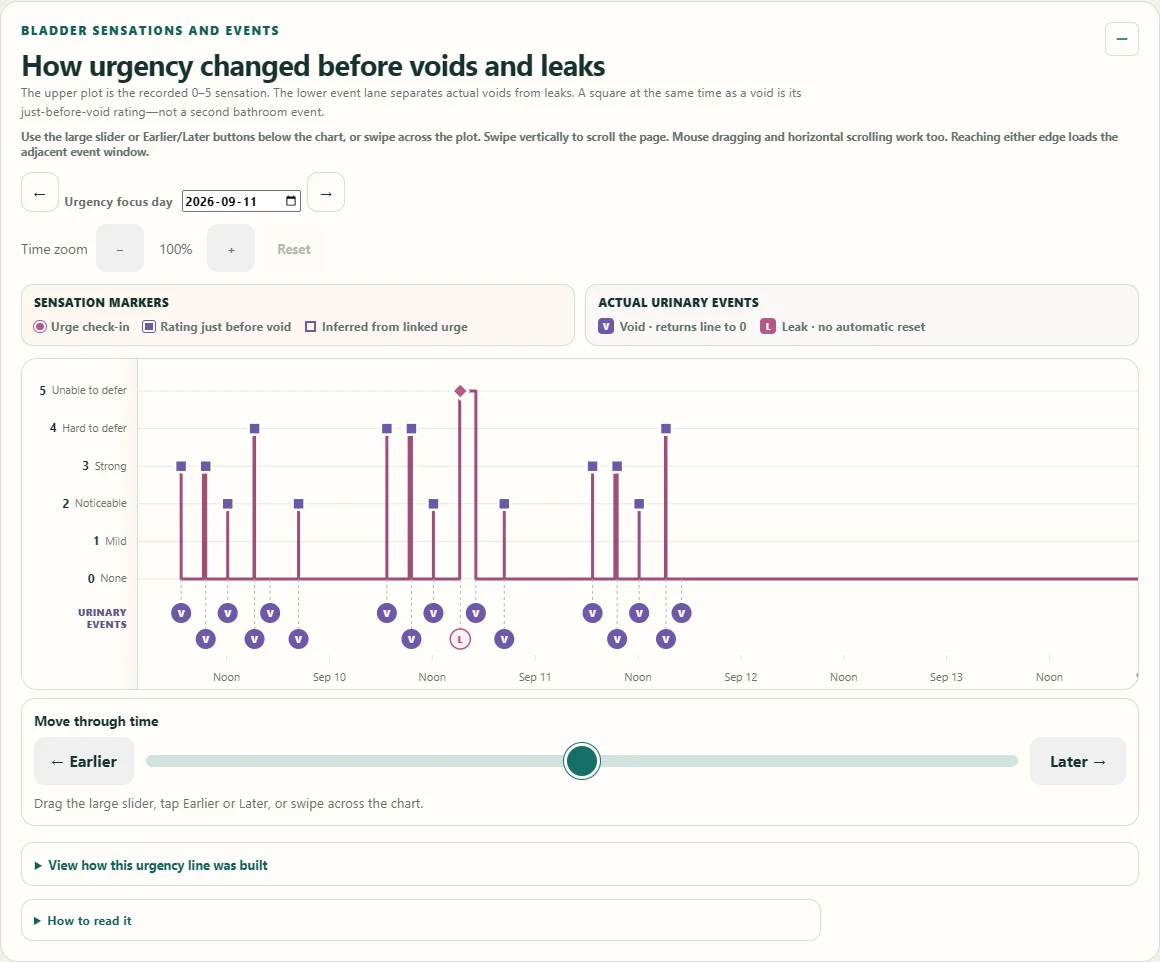
Urgency through the day
See urgency ratings alongside voids and leaks to review how sensations changed through the day.
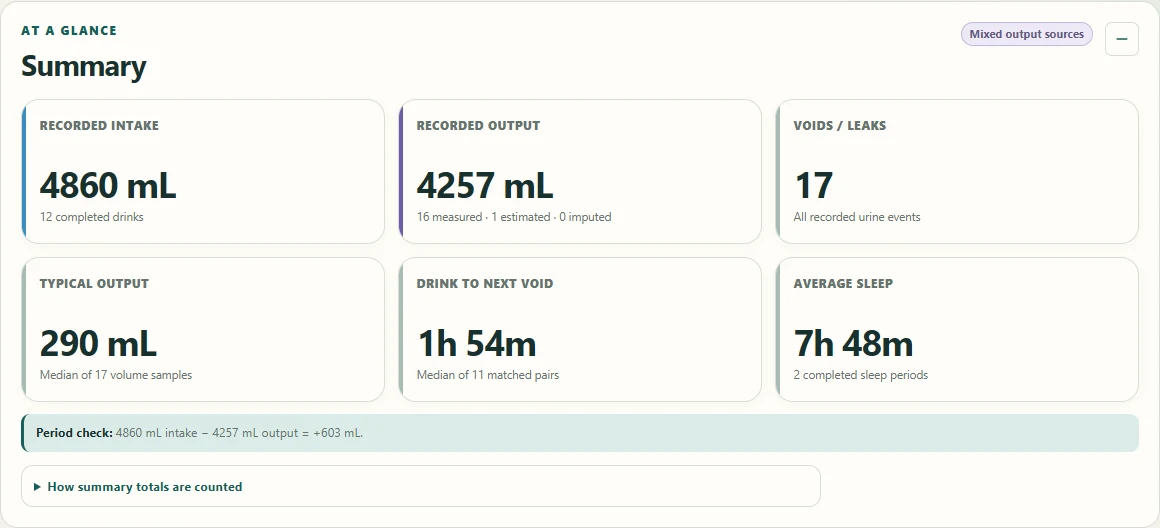
Your recorded totals
Review intake, output, frequency, typical volumes, timing, and sleep for the period you choose.
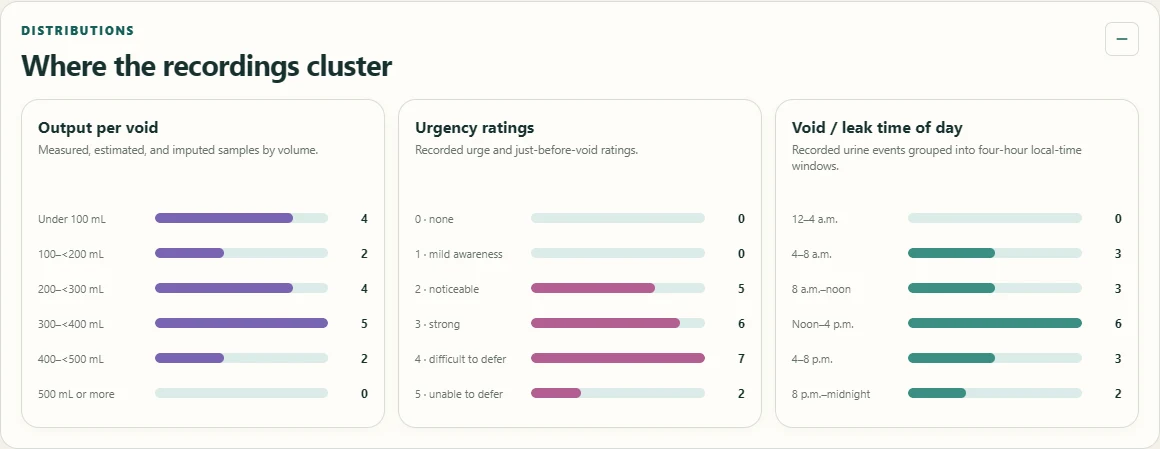
Where observations cluster
Explore when entries were recorded and how urgency ratings and recorded volumes are distributed.